
Building analytics dashboards has always felt heavier than it should. My usual process looked like this: spin up a PostgreSQL instance, migrate the data, and wire a dashboard on top. It works, but it’s slow, and even a small hosted database costs $10–$30/month on AWS RDS. For side projects or quick prototyping, that’s friction you don’t need.
DuckDB flips that workflow on its head. Instead of setting up infrastructure, I can pull in files directly, run SQL immediately, and persist results, all from a lightweight CLI, with almost no overhead.
In this post, I’ll walk through how DuckDB works, how easy it is to query files from the CLI, and how I tied it into a simple dashboard with Plotly Dash.
What is DuckDB?
DuckDB is often called “SQLite for analytics,” which is a solid mental model. Like SQLite, it’s lightweight, local, and serverless, with no clusters, configs, or orchestration.
Where it differs is under the hood: DuckDB uses a columnar storage format, which makes it ideal for OLAP-style queries (aggregations, filters, large scans). In practice, that means I can throw millions of rows at it and get results at speeds you’d normally expect from heavyweight engines like Postgres, Snowflake, or even Spark.
Out of the box, DuckDB can query CSV and Parquet files directly. You don’t need to import or migrate data first. For example, you can run a single query like:
SELECT * FROM 'data-*.parquet'and DuckDB will automatically read every matching file. That makes it perfect for quick exploration, prototyping, or side projects where you don’t want to wrestle with infrastructure.
Where the Fun Begins: DuckDB’s CLI
One of DuckDB’s superpowers is how little ceremony it takes to get started. No server setup, no configs, no Docker Compose files lurking in the background, just the CLI.
With a single command, you can spin up a database file and start running SQL immediately:
duckdb taxi.duckdbFrom there, you can ingest files directly into the database:
CREATE OR REPLACE TABLE taxi AS
SELECT * FROM read_parquet('data/yellow_tripdata_2024-*.parquet')
That’s it. You’ve got a database with millions of rows ready for analysis in seconds.
Now you can run the same kind of queries you’d normally use in PostgreSQL or another RDBMS, except without the overhead of standing up infrastructure. For quick analysis projects, it feels almost unfair.
My Project: Analyzing NYC Taxi Data with DuckDB
To see how DuckDB handled real-world data, I turned to the NYC Taxi dataset. It’s a massive public dataset that logs millions of yellow cab rides each year, with pickup and drop-off times, locations, fares, and trip distances. For this project, I grabbed the 2024 yellow cab trip data and loaded it into DuckDB.
The ingestion step was effortless: using a single glob pattern ('data-*.parquet'), I pulled multiple Parquet files directly into DuckDB. This acted as my raw-to-staging pipeline step, where I consolidated raw trip records into a structured dataset.
Next, I enriched the data by joining it with the official taxi zone lookup table. This turned cryptic location IDs into human-readable zones, the kind of data modeling step that makes downstream analysis far more usable.
What impressed me most was the speed to insight. Normally, analyzing data at this scale would mean spinning up Postgres or BigQuery, migrating data, and waiting around. With DuckDB, I was querying Parquet files directly in minutes.
To make exploration smoother, I layered on a lightweight Plotly Dash dashboard. That way I could flip raw query results into charts and start spotting patterns faster.
With everything wired up, I started asking some fun questions of the data…
Data Quality in Action: Who Tips the Most?
I was curious about tipping behavior. To find which pickup zones had the highest average tips, I joined the trip data with the taxi zones lookup table and averaged tip_amount.
Before calculating averages, I added a basic data quality filter: removing extreme outliers and excluding zones with very few rides. This step is critical in data engineering. Without it, the aggregated results would be skewed by anomalies.
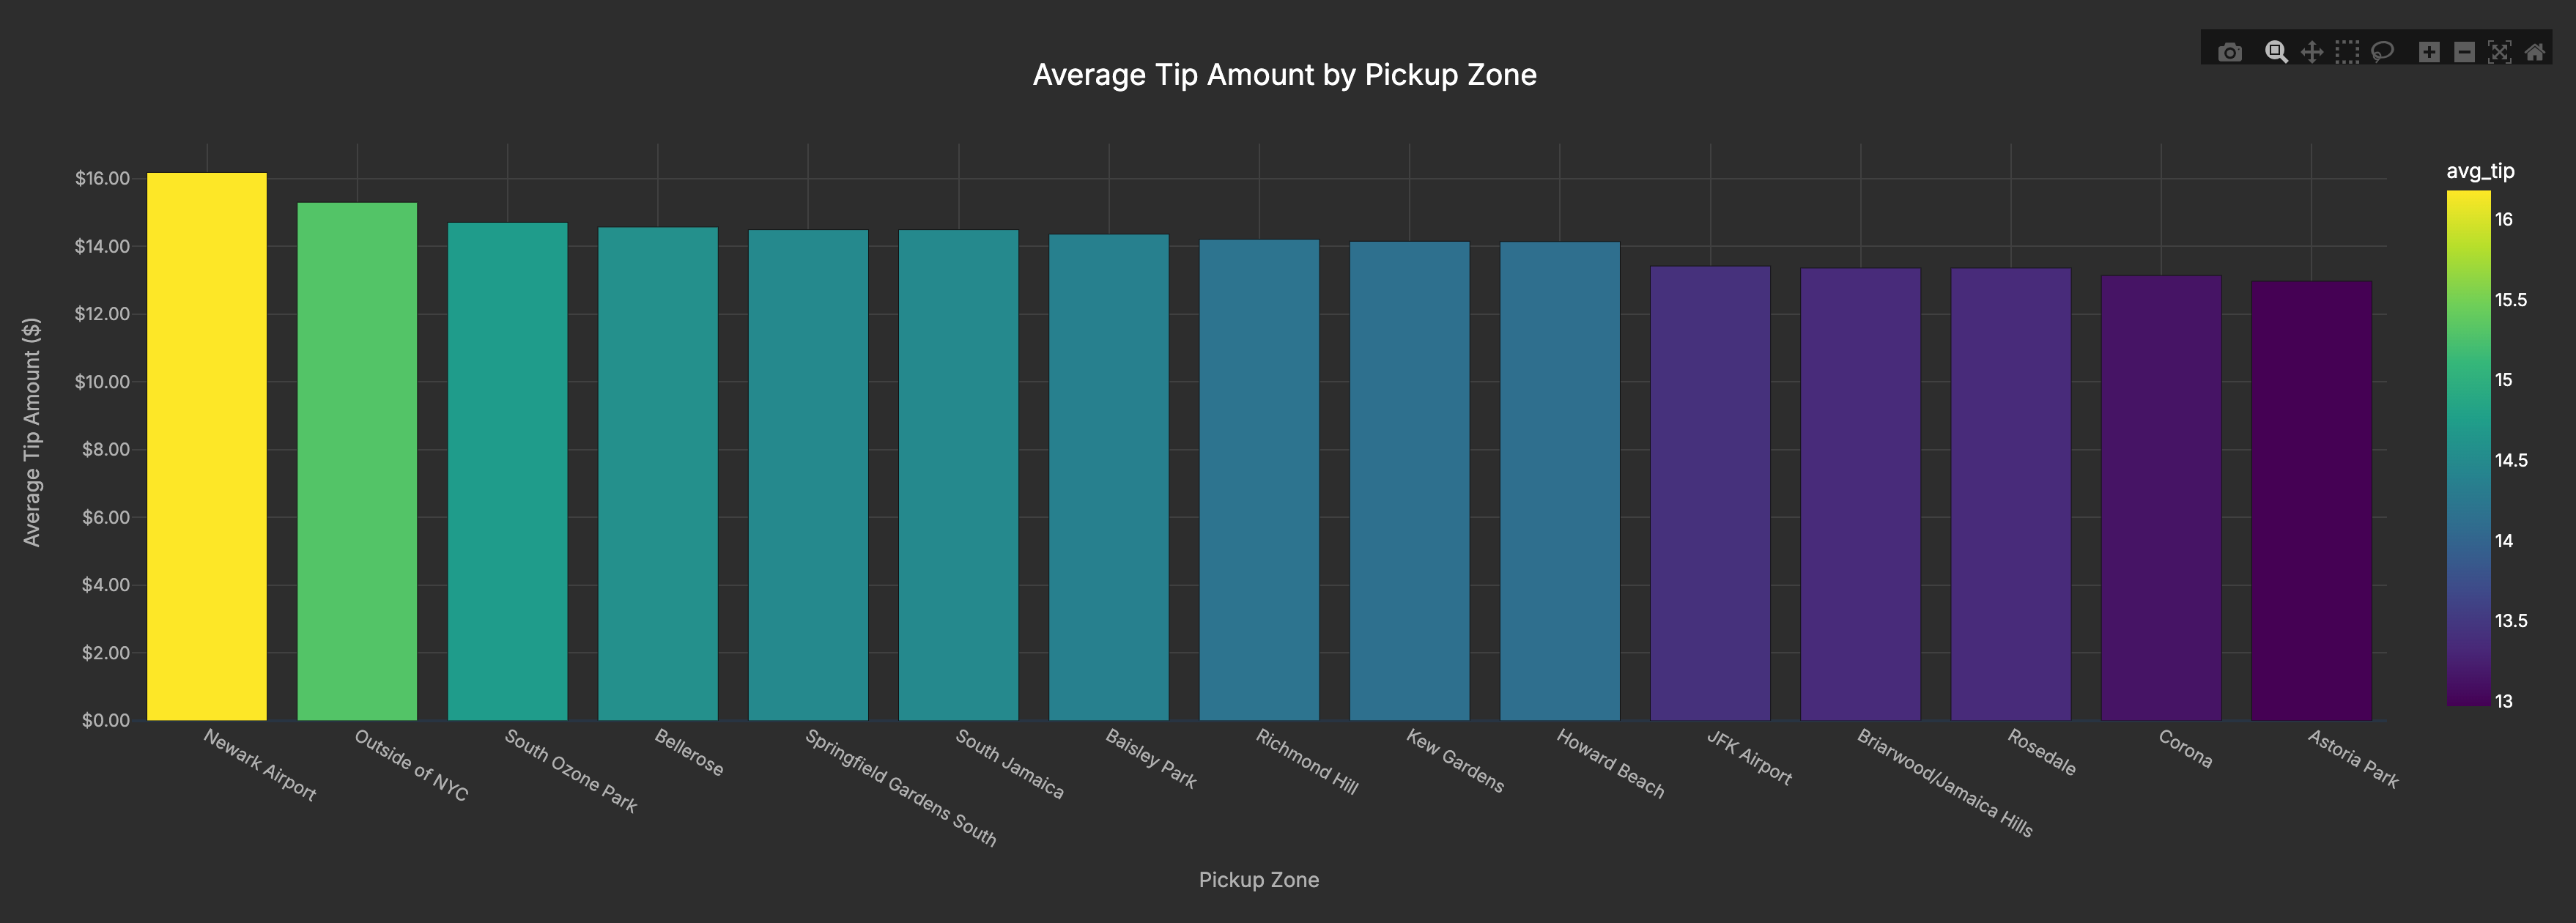
The results were clear: Newark Airport topped the list, even beating out JFK. My theory? Travelers rushing to make flights are extra generous (or just don’t want to argue about tips before boarding).
Route Analysis: Where are People Going?
I also wanted to see which routes are most common, basically where New Yorkers and tourists are shuttling back and forth every day.
The busiest flows are clustered in Manhattan, especially between the Upper East Side and Midtown, which dominate as the most traveled pickup-dropoff pairs. Airport runs (like JFK) show up too, but the real volume is in those daily commute corridors where locals and visitors alike move between residential neighborhoods and business districts.
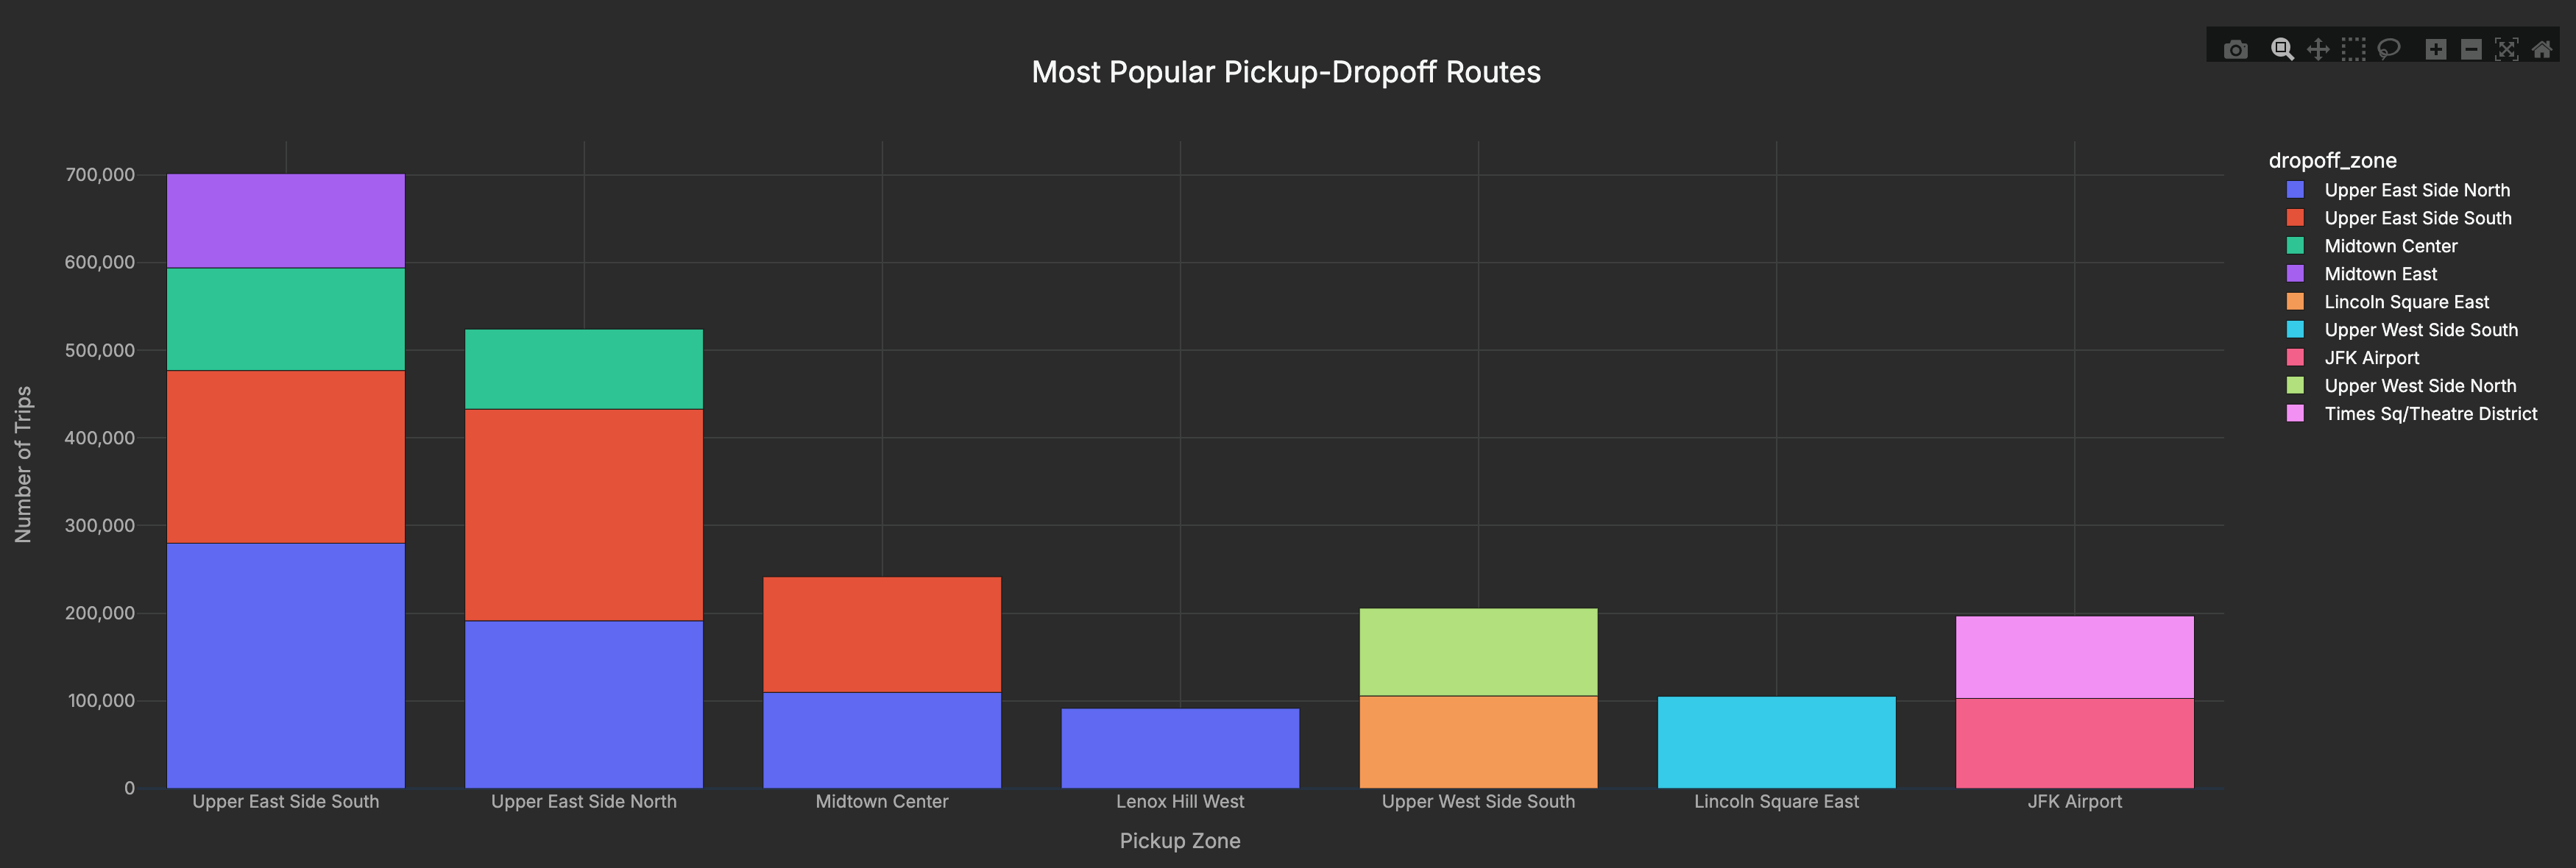
By joining the pickup and dropoff locations to their zone names, I could tally the busiest routes. The Upper East Side to Midtown commute came out on top, with JFK runs also making a strong showing.
Duration Analysis with a CTE: Which Rides Take the Longest?
Finally, I wanted to know which trips stretched the longest. To do that, I created a CTE (Common Table Expression) that calculated the time difference between pickup and dropoff in minutes, then averaged those durations by route.
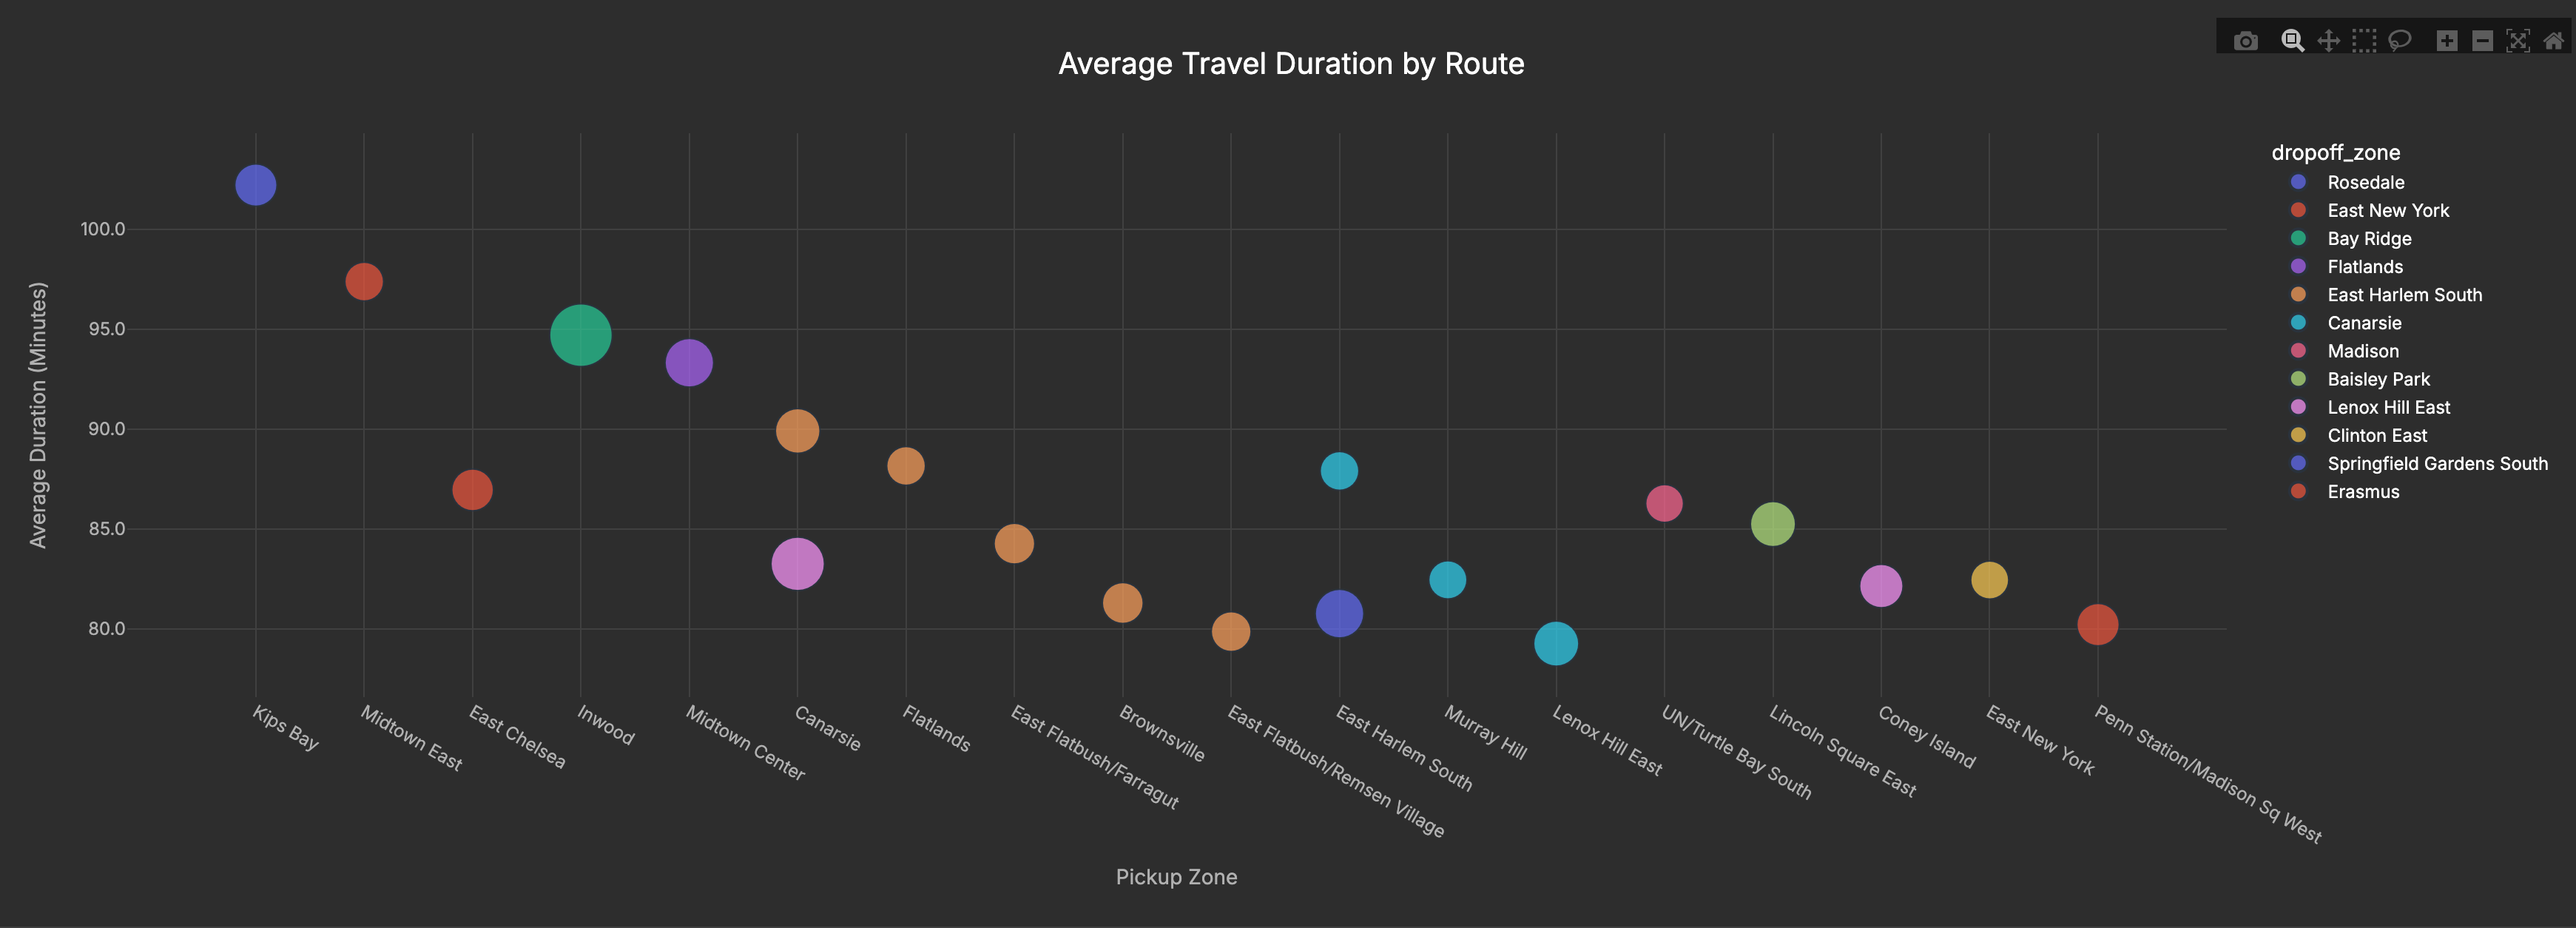
The longest average routes in my sample are cross-borough hauls. Several start in Manhattan (Kips Bay, Midtown East, Inwood) and head to outer-edge destinations like Rosedale and Bay Ridge. Others originate in Brooklyn (e.g., Flatlands/Canarsie). In short: it’s the distance and cross-borough travel driving long times, not simply “outer-borough pickups.
What impressed me wasn’t just the insights. It was how quickly I could get to them. Normally this kind of work would require spinning up Postgres or BigQuery and migrating data. With DuckDB, I was querying Parquet files directly within minutes.
The full project (including instructions to run it yourself) is available here:
👉 NYC Taxi Analysis with DuckDB on GitHub
Closing Thoughts
DuckDB really surprised me with how much data engineering workflow it compresses into a single tool. Instead of provisioning infrastructure and migrating data, I was able to:
- Ingest millions of rows of Parquet files
- Transform & enrich with joins and filters
- Serve insights through a Plotly dashboard
All within minutes, entirely from my laptop. For me, that’s the 80/20 of data engineering: the bulk of value delivered without the usual infrastructure tax.
Looking ahead, I see DuckDB not just as a prototyping tool, but as a building block for serverless pipelines (e.g., AWS Lambda + S3) that skip RDS entirely. This project was my first step in that direction, and I’ll be sharing more experiments as I push it further.
This project was just a first step, but it’s clear that DuckDB has huge potential in the data engineering toolbox. I’ll be sharing more as I experiment with serverless pipelines and other ways to put DuckDB into practice.
👉 If you’re interested in following along with those experiments, subscribe here so you don’t miss the next post.


